
This section contains live maps that are either updated every few minutes, hourly, or daily. These maps are pulled from different government, university, and private sources when you load them and are subject to occassional outages.
When viewing these maps please consider that they are for informational purposes only and usage may be subject to tracking by the individual providers, which is not controllable by ClimateViewer Maps. If you are concerned about privacy, please use a virtual private network (VPN) and avoid being tracked!
Map List
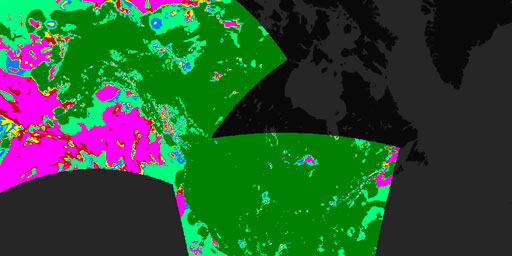
U.S. Surface Visibility
The visibility is indicated on the map by different colors for the following ranges: 0 - 0.24, 0.25 - 0.49, 0.5 - 0.74, 0.75 - 0.99, 1.0 - 2.9, 3.0 - 4.9, 5.0 - 6.9, and 7.0+ miles, in order to corres...
View Map
U.S. Wind Gusts (Heatmap)
Wind speed and wind gust are indicated on the map by different colors for 5 knot increments up to 115 knots. The legend includes tick marks for both knots and miles per hour. The same color scale is u...
View Map
U.S. Wind Speed (Heatmap)
Wind speed and wind gust are indicated on the map by different colors for 5 knot increments up to 115 knots. The legend includes tick marks for both knots and miles per hour. The same color scale is u...
View Map
U.S. Wind Velocity (Barbs)
Wind speed and wind gust are indicated on the map by different colors for 5 knot increments up to 115 knots. The legend includes tick marks for both knots and miles per hour. The same color scale is u...
View MapSharing is Caring
Jim Lee • Creator of ClimateViewer Maps

I am forever a Boy Scout, lifetime artist, nocturnal programmer, music is my life, love is my religion, and I am the luckiest husband and father on Earth. I speak for the trees. I have a passion for mapping, magnets, and mysteries. Feel free to contact me: jim@climateviewer.com


Leave Us A Comment