
The Alerts and Weather section of ClimateViewer.org features in one place a large and diverse collection of over 90 LIVE interactive maps shared by government agencies, universities and other sources that allow public distribution of up-to-the-minute, hourly or daily updates of current, past 24 hour, 5-day or historical activities related to air quality, hurricanes and tropical storms, thunderstorms, wind, lightning, rainfall, snow, river flooding, drought, earthquakes, forest fires, smoke detection, and volcano eruptions.
This section contains live maps that are either updated every few minutes, hourly, or daily. These maps are pulled from different government, university, and private sources when you load them and are subject to occassional outages.
When viewing these maps please consider that they are for informational purposes only and usage may be subject to tracking by the individual providers, which is not controllable by ClimateViewer Maps. If you are concerned about privacy, please use a virtual private network (VPN) and avoid being tracked!
Map Sections
Air Quality
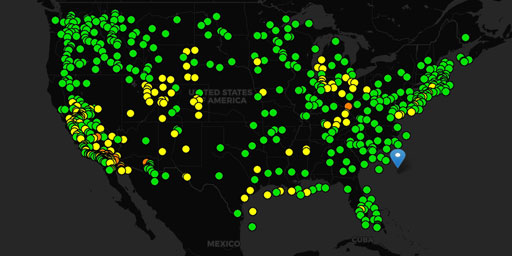
Air Quality Index (Current)
The Air Quality Index (AQI) identifies air quality as it relates to health effects you may experience within a few hours or days after breathing polluted air. Ground-level ozone and airborne particles...
View Map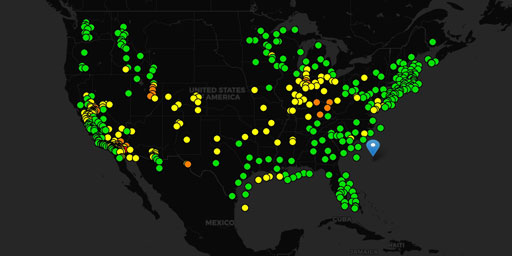
Air Quality Index (Today)
The Air Quality Index (AQI) identifies air quality as it relates to health effects you may experience within a few hours or days after breathing polluted air. Ground-level ozone and airborne particles...
View Map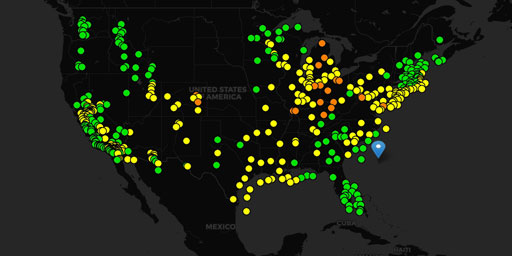
Air Quality Index (Tomorrow)
The Air Quality Index (AQI) identifies air quality as it relates to health effects you may experience within a few hours or days after breathing polluted air. Ground-level ozone and airborne particles...
View Map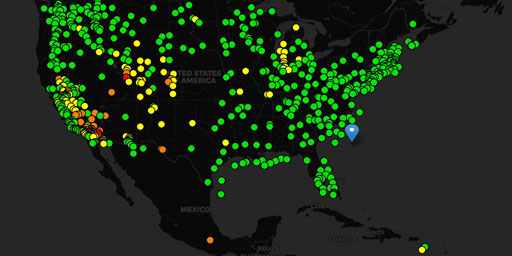
Air Quality Index (Yesterday)
The Air Quality Index (AQI) identifies air quality as it relates to health effects you may experience within a few hours or days after breathing polluted air. Ground-level ozone and airborne particles...
View MapEarthquakes
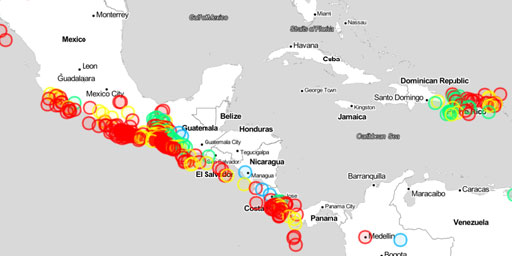
Euro-Med Earthquakes - CSEM/EMSC
The European-Mediterranean Seismological Centre (EMSC) was founded in 1975, following a recommendation from the European Seismological Commission (ESC). The ESC is a regional commission of the Interna...
View Map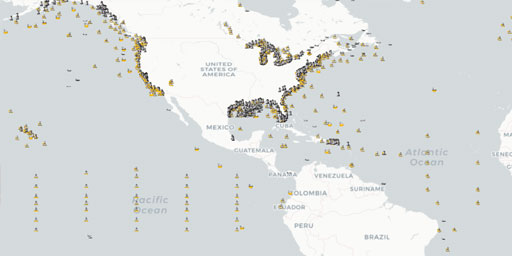
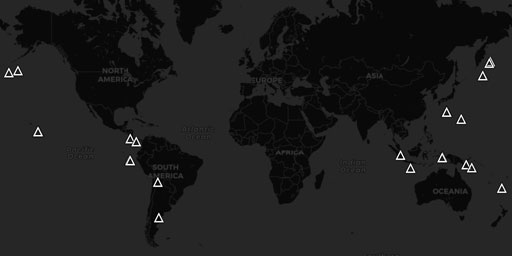
NOAA Ocean Buoys
Our Vision A sustainable and resilient marine observation and monitoring infrastructure which enhances healthy ecosystems, communities, and economies in the face of change. Our Mission To provide qual...
View Map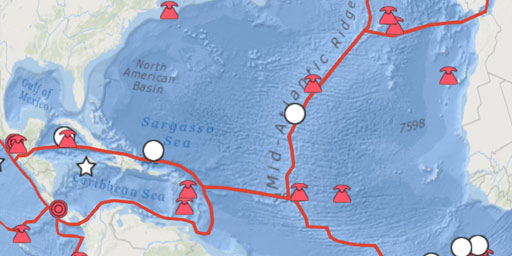
The Topography of Plate Tectonics
This documentary, in the form of a satellite map, attempts to put some real world topography to the Plate Tectonics. With this interactive map you can see the actual land and submarine topography that...
View Map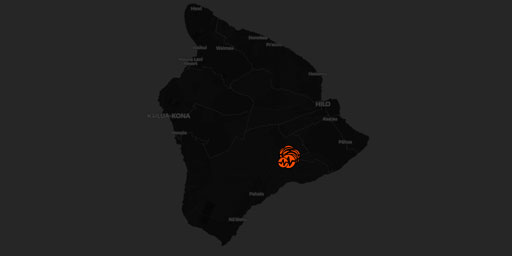
USGS - All Earthquakes (Last Hour)
The USGS Earthquake Hazards Program is part of the National Earthquake Hazards Reduction Program (NEHRP), established by Congress in 1977. We monitor and report earthquakes, assess earthquake impacts ...
View Map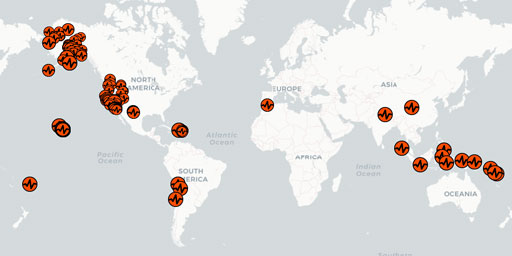
USGS - All Earthquakes (Today)
The USGS Earthquake Hazards Program is part of the National Earthquake Hazards Reduction Program (NEHRP), established by Congress in 1977. We monitor and report earthquakes, assess earthquake impacts ...
View Map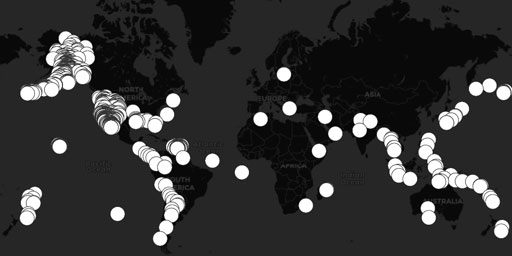
USGS - M1.0+ Earthquakes (Last Week)
The USGS Earthquake Hazards Program is part of the National Earthquake Hazards Reduction Program (NEHRP), established by Congress in 1977. We monitor and report earthquakes, assess earthquake impacts ...
View Map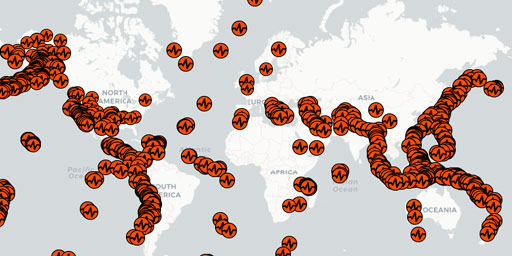
USGS - M2.5+ Earthquakes (Last Month)
The USGS Earthquake Hazards Program is part of the National Earthquake Hazards Reduction Program (NEHRP), established by Congress in 1977. We monitor and report earthquakes, assess earthquake impacts ...
View Map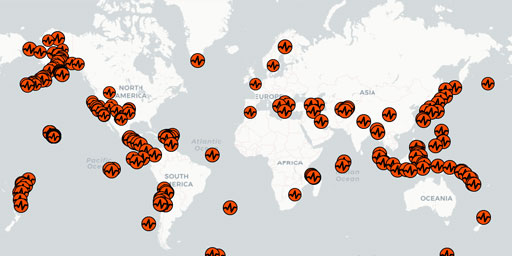
USGS - M2.5+ Earthquakes (Last Week)
The USGS Earthquake Hazards Program is part of the National Earthquake Hazards Reduction Program (NEHRP), established by Congress in 1977. We monitor and report earthquakes, assess earthquake impacts ...
View Map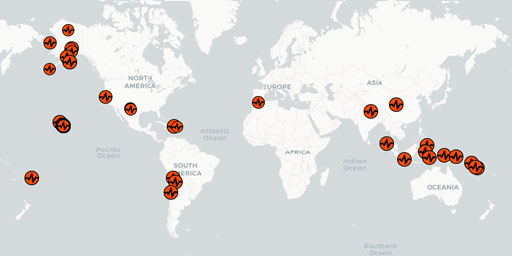
USGS - M2.5+ Earthquakes (Today)
The USGS Earthquake Hazards Program is part of the National Earthquake Hazards Reduction Program (NEHRP), established by Congress in 1977. We monitor and report earthquakes, assess earthquake impacts ...
View Map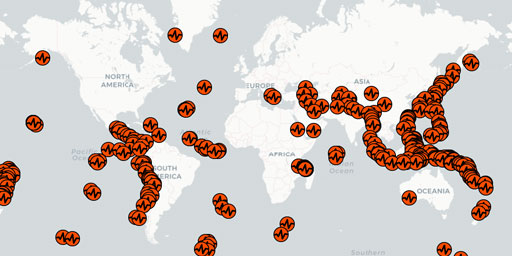
USGS - M4.5+ Earthquakes (Last Month)
The USGS Earthquake Hazards Program is part of the National Earthquake Hazards Reduction Program (NEHRP), established by Congress in 1977. We monitor and report earthquakes, assess earthquake impacts ...
View Map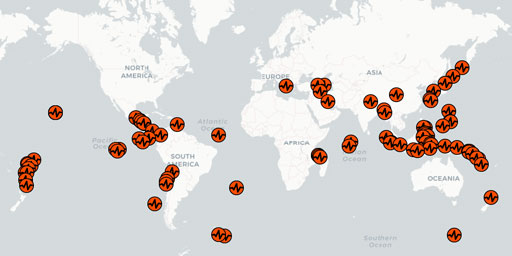
USGS - M4.5+ Earthquakes (Last Week)
The USGS Earthquake Hazards Program is part of the National Earthquake Hazards Reduction Program (NEHRP), established by Congress in 1977. We monitor and report earthquakes, assess earthquake impacts ...
View Map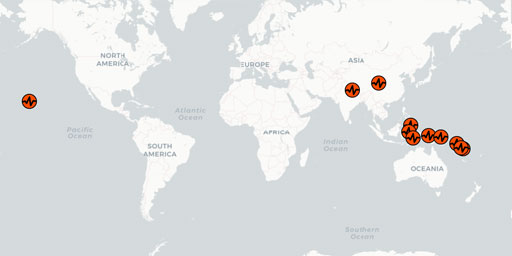
USGS - M4.5+ Earthquakes (Today)
The USGS Earthquake Hazards Program is part of the National Earthquake Hazards Reduction Program (NEHRP), established by Congress in 1977. We monitor and report earthquakes, assess earthquake impacts ...
View Map
USGS - Tectonic Plate Boundaries
The USGS Earthquake Hazards Program is part of the National Earthquake Hazards Reduction Program (NEHRP), established by Congress in 1977. We monitor and report earthquakes, assess earthquake impacts ...
View MapFire and Volcanoes
Active Volcanoes and Eruptions (This Week)
The Smithsonian Institution’s Global Volcanism Program (GVP) is housed in the Department of Mineral Sciences, National Museum of Natural History, in Washington D.C. We are devoted to a better un...
View Map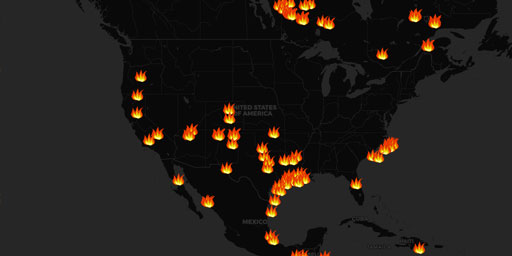
Fire Detection - NOAA Hazard Mapping System
The information on fire position should be used as general guidance and for strategic planning. Tactical decisions, such as the activation of a response to fight these fires and evacuation efforts, sh...
View Map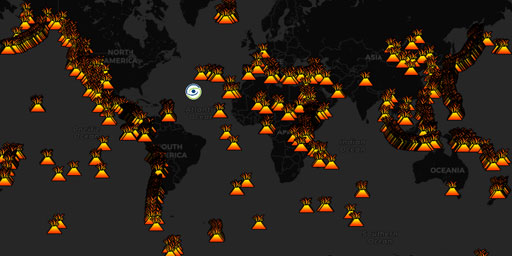
Global Volcanoes (Holocene Period)
The Holocene is the current geological epoch. It began approximately 11,650 cal years before present, after the last glacial period, which concluded with the Holocene glacial retreat. The Holocene and...
View Map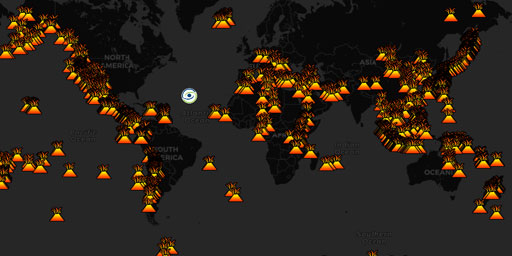
Global Volcanoes (Pleistocene Period)
The Pleistocene (often colloquially referred to as the Ice Age) is the geological epoch which lasted from about 2,588,000 to 11,700 years ago, spanning the world's most recent period of repeated glaci...
View Map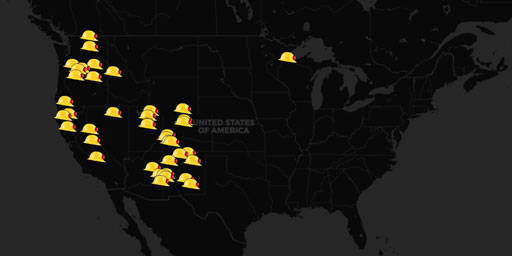
InciWeb Incident Information System
InciWeb is an interagency all-risk incident information management system. The system was developed with two primary missions: (1) Provide the public a single source of incident related information (2...
View Map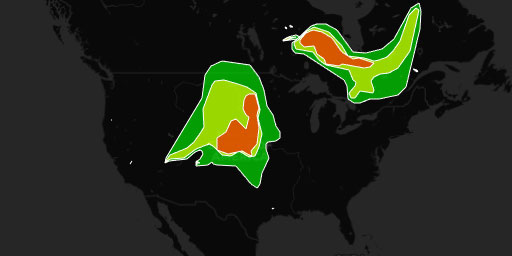
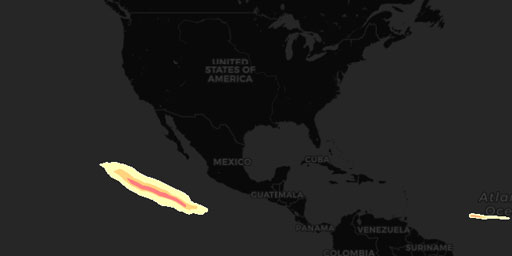
Smoke Detection - NOAA Hazard Mapping System
The information on fire position should be used as general guidance and for strategic planning. Tactical decisions, such as the activation of a response to fight these fires and evacuation efforts, sh...
View MapHurricane and Tropical Storms
Tropical Cyclone Current Wind Extent
This nowCOAST time-enabled map service provides maps depicting the latest official NWS tropical cyclone forecast tracks and watches and warnings for all active systems in the Atlantic, Caribbean Sea, ...
View Map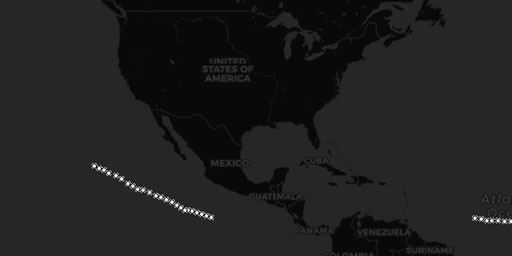
Tropical Cyclone Observed Center Positions
This nowCOAST time-enabled map service provides maps depicting the latest official NWS tropical cyclone forecast tracks and watches and warnings for all active systems in the Atlantic, Caribbean Sea, ...
View Map
Tropical Cyclone Observed Surface Wind Swath
This nowCOAST time-enabled map service provides maps depicting the latest official NWS tropical cyclone forecast tracks and watches and warnings for all active systems in the Atlantic, Caribbean Sea, ...
View Map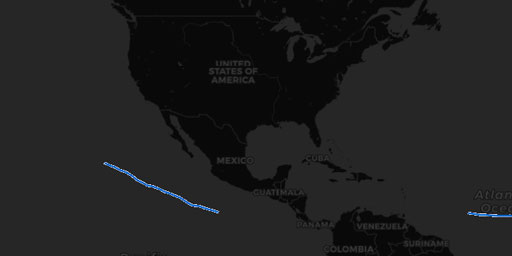
Tropical Cyclone Observed Track Line
This nowCOAST time-enabled map service provides maps depicting the latest official NWS tropical cyclone forecast tracks and watches and warnings for all active systems in the Atlantic, Caribbean Sea, ...
View Map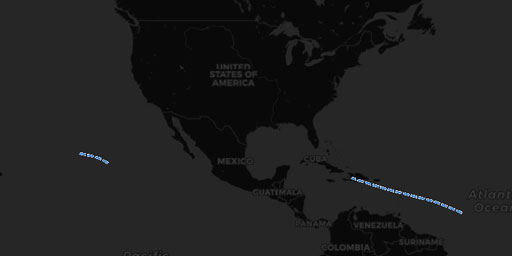
Tropical Cyclone Track Line Forecasts
This nowCOAST time-enabled map service provides maps depicting the latest official NWS tropical cyclone forecast tracks and watches and warnings for all active systems in the Atlantic, Caribbean Sea, ...
View Map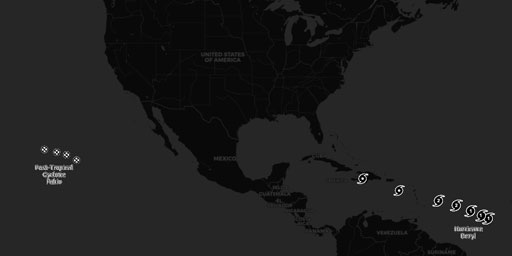
Tropical Storm Tracking (U.S. Naval Oceanography Portal)
Provide timely, comprehensive, and tactically relevant meteorological and oceanographic (METOC) products and services in direct support of Fleet training and readiness; deploying Carrier and Expeditio...
View MapLightning

Lightning Strike Density
The Lightning Strike Density maps highlight the location of lightning cores and trends of increasing and decreasing activity. The maps depict the density of lightning strikes, cloud-to-ground strikes,...
View MapRain and Snow
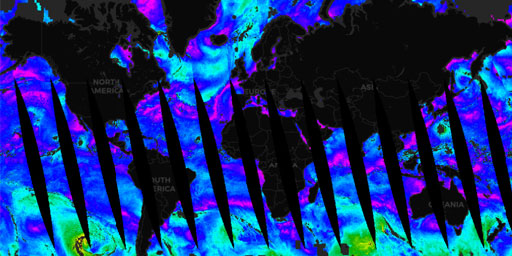
AMSR2 GCOM-W1 - Surface Precipitation Rate (Day)
Advanced Microwave Scanning Radiometer 2 (AMSR2) - Global Change Observation Mission 1st Water (GCOM-W1) National Aeronautics and Space Administration (NASA) Earth Observing System Data and Informati...
View Map
AMSR2 GCOM-W1 - Surface Precipitation Rate (Night)
Advanced Microwave Scanning Radiometer 2 (AMSR2) - Global Change Observation Mission 1st Water (GCOM-W1) National Aeronautics and Space Administration (NASA) Earth Observing System Data and Informati...
View Map
AMSR2 GCOM-W1 - Surface Rain Rate (Day)
Advanced Microwave Scanning Radiometer 2 (AMSR2) - Global Change Observation Mission 1st Water (GCOM-W1) National Aeronautics and Space Administration (NASA) Earth Observing System Data and Informati...
View Map
AMSR2 GCOM-W1 - Surface Rain Rate (Night)
Advanced Microwave Scanning Radiometer 2 (AMSR2) - Global Change Observation Mission 1st Water (GCOM-W1) National Aeronautics and Space Administration (NASA) Earth Observing System Data and Informati...
View Map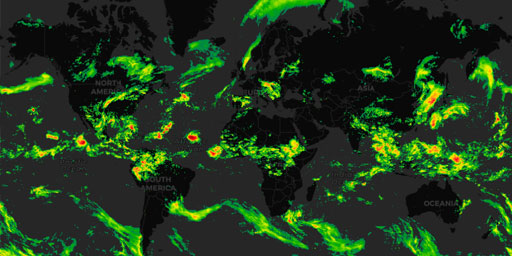
IMERG - Rain Rate (Early)
The Integrated Multi-satelliE Retrievals for GPM (IMERG) National Aeronautics and Space Administration (NASA) Earth Observing System Data and Information System (EOSDIS) Global Imagery Browse Service...
View Map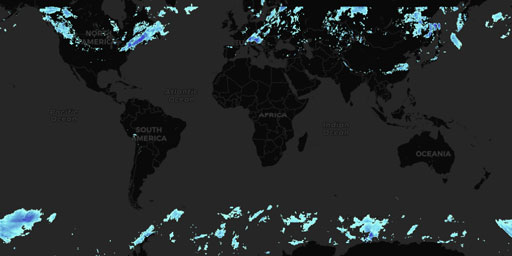
IMERG - Snow Rate (Early)
The Integrated Multi-satelliE Retrievals for GPM (IMERG) National Aeronautics and Space Administration (NASA) Earth Observing System Data and Information System (EOSDIS) Global Imagery Browse Service...
View Map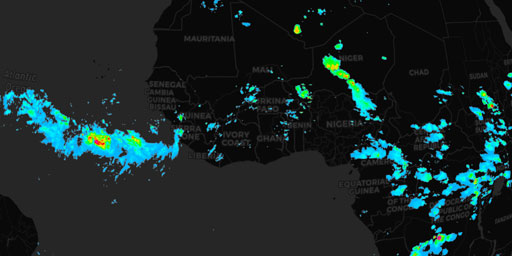
Multi-Sensor Precipitation Estimate - 0 Degree
The Multi-Sensor Precipitation Estimate (MPE) product consists of the near-real-time rain rates in mm/hr for each Meteosat image in original pixel resolution. The algorithm is based on the combination...
View Map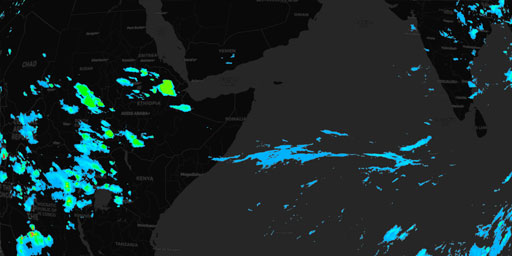
Multi-Sensor Precipitation Estimate - 41.5 Degree
The Multi-Sensor Precipitation Estimate (MPE) product consists of the near-real-time rain rates in mm/hr for each Meteosat image in original pixel resolution. The algorithm is based on the combination...
View Map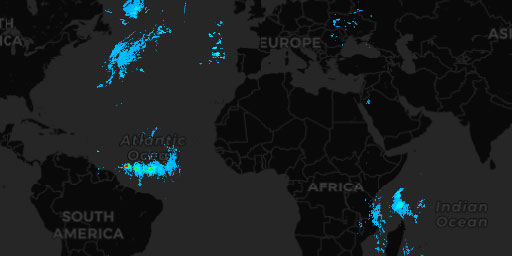
Rainfall Atlantic Ocean - MET0D
EUMETSAT’s Nowcasting Satellite Application Facility (NWC SAF) provides operational services to ensure the optimum use of meteorological satellite data in Nowcasting and Very Short Range Forecasting. ...
View Map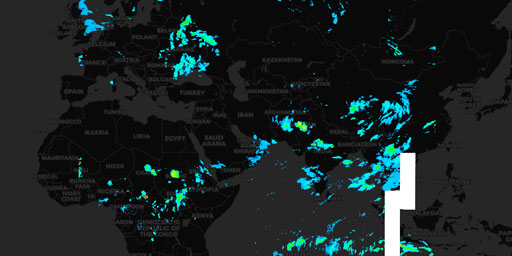
Rainfall Indian Ocean - IODC
EUMETSAT’s Nowcasting Satellite Application Facility (NWC SAF) provides operational services to ensure the optimum use of meteorological satellite data in Nowcasting and Very Short Range Forecasting. ...
View Map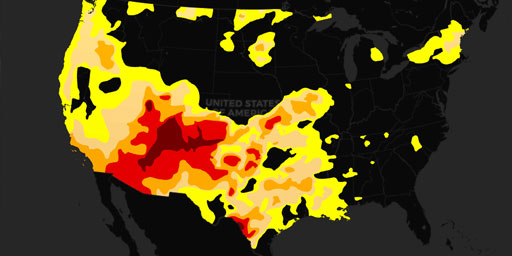
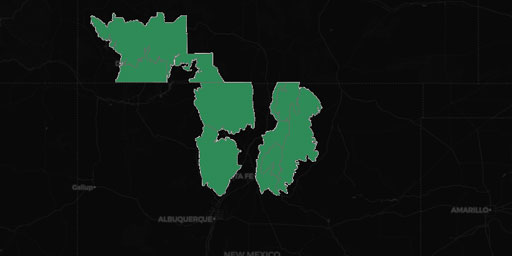
U.S. Drought Monitor
The U.S. Drought Monitor, established in 1999, is a weekly map of drought conditions produced jointly by the National Oceanic and Atmospheric Administration, the U.S. Department of Agriculture, and th...
View Map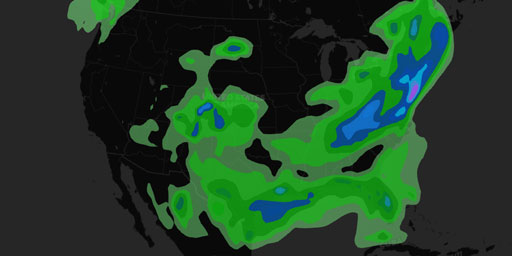
U.S. Rainfall - 24 Hour Forecast
The QPF desk prepares and issues forecasts of accumulating (quantitative) precipitation, heavy rain, heavy snow, and highlights areas with the potential for flash flooding. The basic QPF products are ...
View Map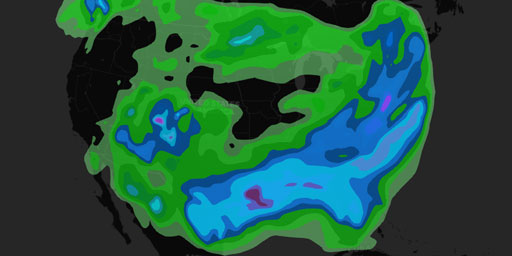
U.S. Rainfall - 5 Day Forecast
The QPF desk prepares and issues forecasts of accumulating (quantitative) precipitation, heavy rain, heavy snow, and highlights areas with the potential for flash flooding. The basic QPF products are ...
View Map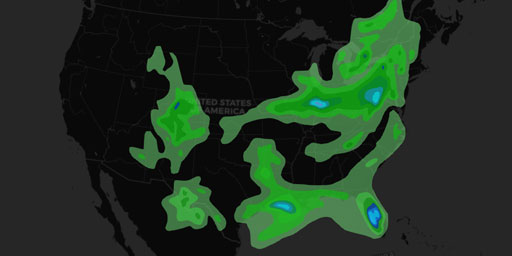
U.S. Rainfall - 6 Hour Forecast
The QPF desk prepares and issues forecasts of accumulating (quantitative) precipitation, heavy rain, heavy snow, and highlights areas with the potential for flash flooding. The basic QPF products are ...
View Map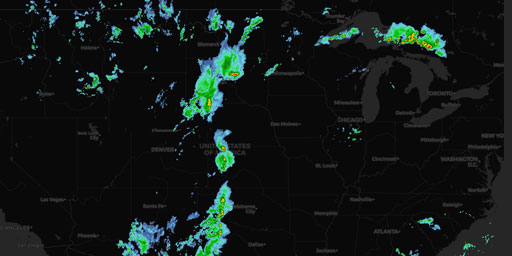
U.S. Rainfall - Multi-Radar/Multi-Sensor (MRMS) System NEXRAD Weather Radar
The Weather radar base reflectivity mosaics are created using data from U.S. Weather Surveillance Radar 1988 Doppler (WSR-88D) sites operated by NWS and DOD and also from the Canadian Environment and ...
View Map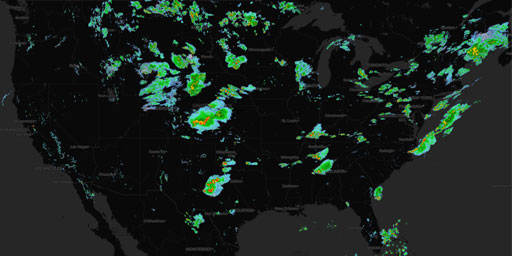
U.S. Rainfall - NEXRAD Radar, Base Reflectivity
NEXRAD or Nexrad (Next-Generation Radar) is a network of 159 high-resolution S-band Doppler weather radars operated by the National Weather Service (NWS), an agency of the National Oceanic and Atmosph...
View Map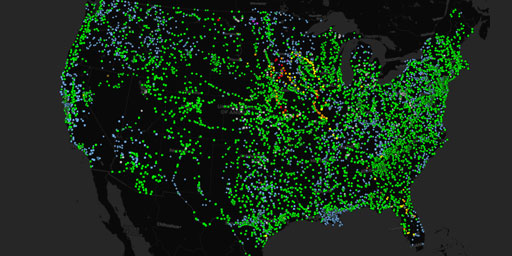
U.S. River Flood Levels
Advanced Hydrologic Prediction Service (AHPS) is a new and essential component of our Climate, Water, and Weather Services. AHPS is a web-based suite of accurate and information-rich forecast products...
View Map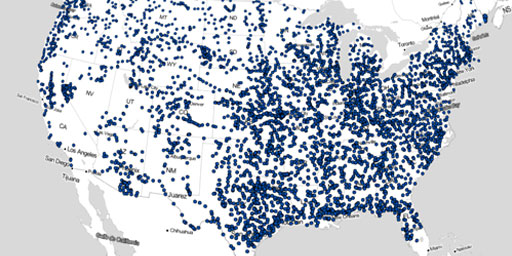
U.S. River Gauges
Advanced Hydrologic Prediction Service (AHPS) is a new and essential component of our Climate, Water, and Weather Services. AHPS is a web-based suite of accurate and information-rich forecast products...
View Map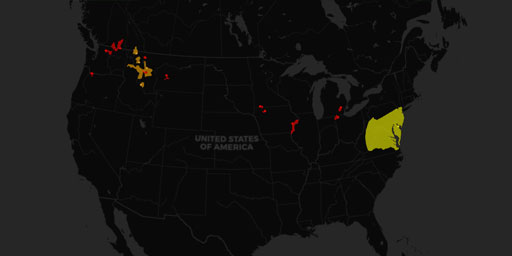
U.S. Significant Flood Risk
The QPF desk prepares and issues forecasts of accumulating (quantitative) precipitation, heavy rain, heavy snow, and highlights areas with the potential for flash flooding. The basic QPF products are ...
View Map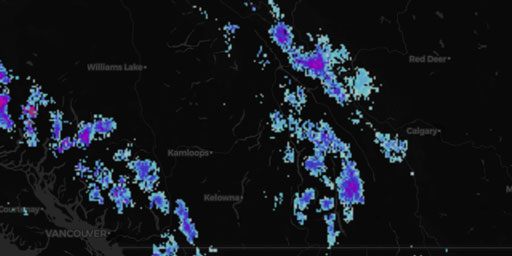
U.S. Snow Depth
The National Operational Hydrologic Remote Sensing Center (NOHRSC) ingests daily ground-based, airborne, and satellite snow observations from all available electronic sources for the coterminous U.S. ...
View Map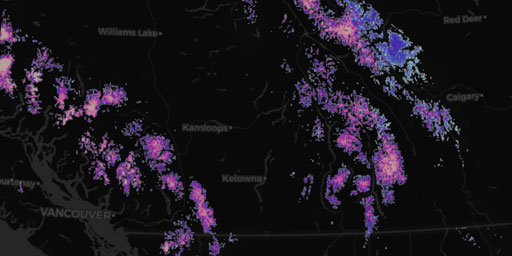
U.S. Snow Water Equivalent
The National Operational Hydrologic Remote Sensing Center (NOHRSC) ingests daily ground-based, airborne, and satellite snow observations from all available electronic sources for the coterminous U.S. ...
View MapWatches and Warnings
NOAA Watches, Warnings, Advisories, Statements
This nowCOAST map service provides maps depicting NWS latest active public alerts, watches, warnings, advisories, and special statements.
View MapWind
AMSR2 GCOM-W1 - Wind Speed (Day)
Advanced Microwave Scanning Radiometer 2 (AMSR2) - Global Change Observation Mission 1st Water (GCOM-W1) National Aeronautics and Space Administration (NASA) Earth Observing System Data and Informati...
View Map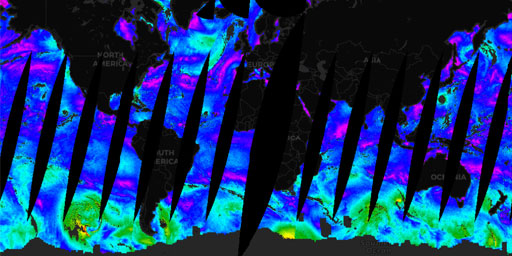
AMSR2 GCOM-W1 - Wind Speed (Night)
Advanced Microwave Scanning Radiometer 2 (AMSR2) - Global Change Observation Mission 1st Water (GCOM-W1) National Aeronautics and Space Administration (NASA) Earth Observing System Data and Informati...
View MapJim Lee • Creator of ClimateViewer Maps

I am forever a Boy Scout, lifetime artist, nocturnal programmer, music is my life, love is my religion, and I am the luckiest husband and father on Earth. I speak for the trees. I have a passion for mapping, magnets, and mysteries. Feel free to contact me: jim@climateviewer.com