
The U.S. Drought Monitor, established in 1999, is a weekly map of drought conditions produced jointly by the National Oceanic and Atmospheric Administration, the U.S. Department of Agriculture, and the National Drought Mitigation Center at the University of Nebraska-Lincoln. The U.S. Drought Monitor website is hosted and maintained by the drought center.
The weekly maps are released at 8:30 a.m. Eastern Standard Time each Thursday and are assessments of past conditions based on data through 7 a.m. Eastern time (8 a.m. Eastern Daylight Time) the preceding Tuesday. The map is based on measurements of climatic, hydrologic and soil conditions as well as reported impacts and observations from more than 350 contributors around the country. Eleven climatologists from the partner organizations take turns serving as the lead author each week. The authors examine all the data and use their best judgment to reconcile any differences among sources.
We stress that the map isn’t a strictly quantitative product and the community of drought observers lends credibility to the state-of-the-art blend of science and subjectivity.
The U.S. Drought Monitor is used by policymakers and media in discussions of drought and in allocations of drought relief. The U.S. Department of Agriculture’s Farm Service Agency uses the U.S. Drought Monitor to distribute relief through the Livestock Forage Disaster Program, the Livestock Assistance Grant Program, and the Non-Fat Dry Milk Program. The Internal Revenue Service also uses the U.S. Drought Monitor to determine the replacement period for livestock sold because of drought. As part of its response to the drought of 2012, the U.S. Department of Agriculture streamlined the process for secretarial disaster declarations, making declarations nearly automatic for a county shown in severe drought on the U.S. Drought Monitor for eight consecutive weeks.
Countries around the world have sought to emulate the U.S. Drought Monitor, and several countries now use a version of their own.
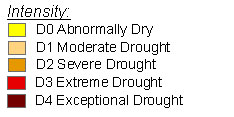
Map Legend
Map Type
Keyhole Markup Language (Google Earth KML)
Map Source
http://droughtmonitor.unl.edu/data/kmz/usdm_current.kmz
More Info
http://droughtmonitor.unl.edu/AboutUSDM.aspx
Attribution
University of Nebraska-Lincoln, US. Drought MonitorJim Lee • Creator of ClimateViewer Maps

I am forever a Boy Scout, lifetime artist, nocturnal programmer, music is my life, love is my religion, and I am the luckiest husband and father on Earth. I speak for the trees. I have a passion for mapping, magnets, and mysteries. Feel free to contact me: jim@climateviewer.com